NYC Restaurant Health Ratings

There are twenty seven thousand restaurants in New York City, which are required to comply with food safety regulations. Health inspectors make unannounced visits to restaurants and perform several checks to ensure food ingredients are healthy and conditions are sanitary.
The city publishes a comprehsensive dataset of its health inspections on its open data portal. I am curious to see how the information lines up with my expectations and experiences in the city. The data may confirm knowledge knowledge or help me gain new insights. To guide my data exploration, I ask myself the following research questions:
- How do restaurant ratings vary and by what factors?
- What can we learn about health inspections?
- How well does our dataset inform our research?
Data Exploration
Dataset
The city’s dataset includes about four hundred thousand records of restaurant violations issued issued between 2013 and 2020. The dataset captures the following features:
- Restaurant: cuisine, GPS coordinates, zipcode, census tract, etc.
- Inspection and Citation data: categories, grades, inspection date

Observations — Geographical Differences
Roughly, nine out of ten restaurants receive an ‘A’ rating. Health ratings don’t vary much between borough. There appears to be some variation as we move across zipcodes. However, we need to examine this information more deeply and to understand factors that explain differences. For instance, zipcodes can greatly in terms of area, population and zoning.

Mapping New York City Restaurant Ratings
The map below captures all restaurants rated ‘B’ or ‘C’. The size of the dots increase with the number of active health code violations. Please visit this link for a dynamic version of this map where you can drag and zoom.

Restaurant inspections — Trends over Time
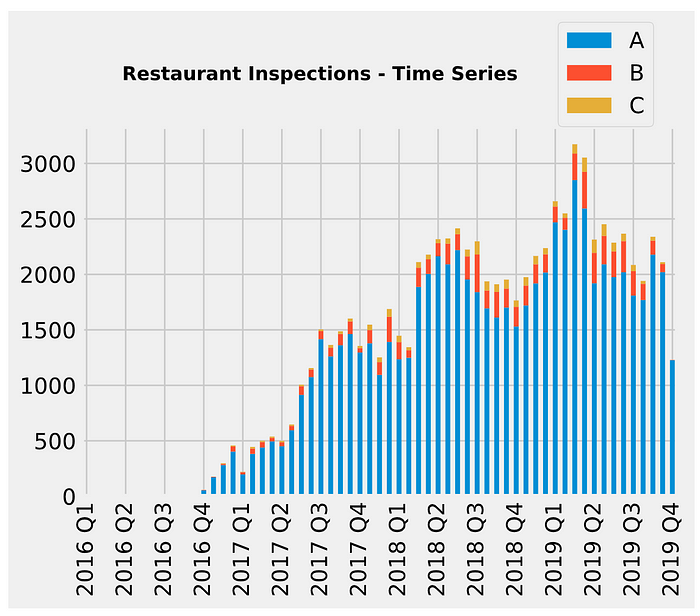
Although the dataset captures historical information beginning 2013 onwards, data prior to 2017 is sparse. Hence, I truncated the chart to exclude 2013–2015. At first glance it appears as though inspections have become more frequent over time. However, we need to dig deeper to determine if this is really true. For instance:
- Data retention policy: The sparsity of data prior to 2016 leads me to think that a full history of information is not available for a few restaurants.
- Restaurant count: The inspection count may relate to the number of restaurants in business
- Survivorship: The current population only includes restaurants that surived till 2020. What happens if we include the original population from the beginning of this period?
Conclusion
This dataset provides an excellent starting point to futher analyze the restaurant business in New York. It has a comprehensive list of restaurants, which can be combined with commercial and public datasets to reveal useful insights.

